Data Science Intern @ CODMAV Research Centre (PES University)
PES University · Jan 2026 – May 2026
Overview
During my tenure at the Centre of Data Modelling, Analytics and Visualization (CODMAV), I worked at the intersection of healthcare and Artificial Intelligence. My primary objective was to build a robust predictive system capable of identifying lung cancer risk at an early stage, which is critical for patient survival rates.
The Technical Challenge
The core difficulty of this project lay in the sheer scale and sparsity of the raw clinical data. Sourced from the Harvard Dataverse (Lung Cancer Risk Prediction Dataset) , the initial dataset was massive but significantly noisy, comprising 22,811 patient records and 788 health markers.
1. Data Refinement Workflow
To transform this high-dimensional, sparse data into a usable format, I implemented a rigorous multi-stage cleaning pipeline:
- Null Elimination: Removed all columns that were entirely empty across all 22,811 records.
- Sparsity Filtering: Identified and removed features with fewer than 1,000 filled entries, ensuring that only statistically significant markers remained.
- Advanced Data Imputation: For the remaining features, I implemented Random Forest-based missing value imputation. By using decision trees to predict missing values based on patterns in existing data, I maintained the integrity of the clinical relationships between variables.
2. Clinical Feature Validation
This process distilled the initial 788 markers down to a critical set of 89 core features. To ensure the model remained grounded in medical reality, these 89 markers were vetted and validated by a professional oncologist to align with established diagnostic standards.
Health Markers
| Age | Gender |
| Smoking History | Chest Pain |
| Fatigue | Coughing of Blood |
| Shortness of Breath | Weight Loss |
| Wheezing | Swallowing Difficulty |
Note: These are just 10 illustrative markers from the final set of 89 medically-validated features used for model training.
The Machine Learning Pipeline
Building a high-accuracy clinical tool required a multi-stage pipeline, moving from massive feature reduction to complex model ensembling.
Step 1: Dimensionality Reduction
Definition: The process of reducing the number of input variables in a dataset while preserving as much information as possible. This prevents the “curse of dimensionality” and improves model speed.
I compared four distinct algorithms to reduce our 89 clinical features into a lean, highly-predictive subset.
| Algorithm | Features Kept | Why Chose This? | Pros | Cons |
|---|---|---|---|---|
| Principal Component Analysis (PCA) | 31 | To capture maximum variance through linear combinations. | Fast; removes correlated features. | Results are hard for doctors to interpret. |
| Brain Storm Optimization (BSO) | 51 | A swarm-intelligence approach to find global optimums. | Avoids local optima; highly robust. | Computationally expensive. |
| Recursive Feature Elimination (RFE) | 31 | Iteratively prunes the least important features. | Very accurate; considers feature interactions. | Can be slow on large datasets. |
| SelectKBest | 51 | Uses statistical tests (Chi-Squared) to pick top features. | Simple and very fast. | Ignores relationships between features. |
Step 2: Individual Model Training
Definition: Training diverse classification architectures to identify which mathematical approach best fits the patterns of lung cancer risk.
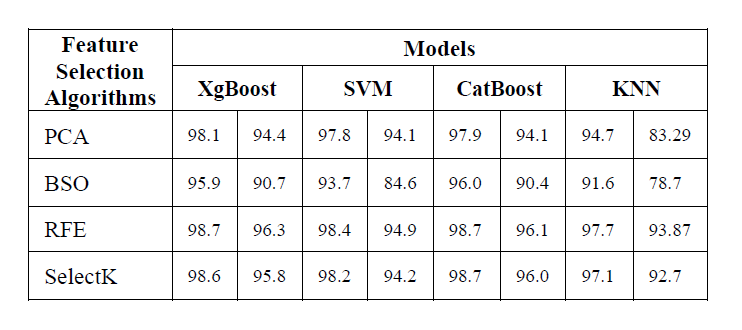
I applied 4 industry-standard models to each of the reduced datasets created in Step 1.
| Model Name | Why Chose This? | Pros | Cons |
|---|---|---|---|
| Extreme Gradient Boosting (XGBoost) | Known for high performance and speed. | Handles missing data; very accurate. | Can overfit if not tuned carefully. |
| Categorical Boosting (CatBoost) | Specialized in handling categorical clinical data. | Reduces overfitting; requires less tuning. | Slower training compared to XGBoost. |
| Support Vector Machine (SVM) | Effective in high-dimensional spaces. | Memory efficient; clear margin of separation. | Not suitable for very large datasets. |
| K-Nearest Neighbors (KNN) | A simple, similarity-based baseline. | Easy to implement; no training phase. | Sensitive to noisy data and outliers. |
Step 3: The Voting Ensemble Strategy
Definition: A “Wisdom of the Crowd” approach where multiple models are combined to produce one superior prediction.
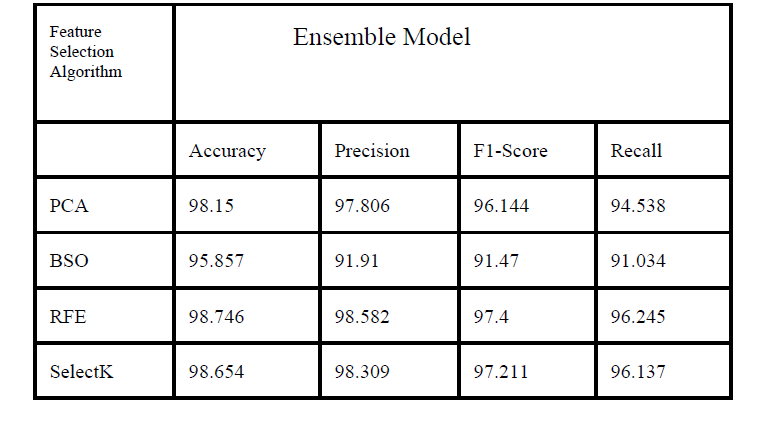
To maximize reliability, I developed a Voting Ensemble Model. Instead of relying on a single algorithm, this ensemble takes the predictions from XGBoost, CatBoost, SVM, and KNN and combines them.
How it works: I used Soft Voting, where the ensemble calculates the average probability predicted by each model. If the average probability for “High Risk” is above 50%, the final system flags it. This smooths out the individual errors of any single model.
The Results: The Ensemble approach, when paired with Recursive Feature Elimination (RFE), yielded the best results for clinical application.
- Accuracy: 98.75%
- Recall (Sensitivity): 96.25%
Novelty
The primary novelty of this research lies in the comprehensive comparative analysis of traditional statistical feature selection versus advanced meta-heuristic and elimination techniques for lung cancer risk prediction.
Key innovations include:
Heuristic Integration: Applying Brain Storm Optimization (BSO), a swarm-intelligence algorithm, to explore the high-dimensional clinical feature space—a method rarely applied in lung cancer diagnostic pipelines.
Clinical-Algorithmic Hybrid: Bridging the gap between pure data science and medical practice by having the algorithmically-selected features validated by an oncologist for clinical relevance.
Custom Ensemble Architecture: Implementing a Soft-Voting Ensemble that specifically prioritizes Recall, ensuring the system minimizes false negatives which is critical in early-stage cancer screening.
Conclusion and Future Work
Our study successfully developed a high-precision prediction system achieving a peak accuracy of 98.81%. This demonstrates that a carefully curated set of clinical health markers can serve as a robust preliminary screening tool.
Future Work:
Real-world Deployment: Integrating this model into hospital management systems for pilot testing on live patient data.
Dynamic Data Integration: Expanding the feature set to include real-time genomic markers and imaging data (like low-dose CT scan reports) for even higher diagnostic depth.
Model Explainability: Incorporating SHAP or LIME values to provide doctors with “explainable AI” reasons for every high-risk flag raised.
Research & Publication
My research findings and the methodology developed during this internship were peer-reviewed and accepted for publication.
Paper Title: “Predictive Analytics for Early Lung Cancer Risk using Machine Learning”.
Venue: 2025 IEEE International Conference on Contemporary Computing and Communications (InC4).
Indexing: Accepted for inclusion in IEEE Xplore Digital Library.